Aim: Create a dashboard showing the sales performance of a pizza restaurant, including the best and worst sales periods, products, and customer ordering habits.
Tools: PostgreSQL and Tableau
Sales Dashboard: This dashboard and associated SQL queries explore restaurant sales over increasingly granular periods. Some sample queries are provided below to demonstrate the requisite data transformations.
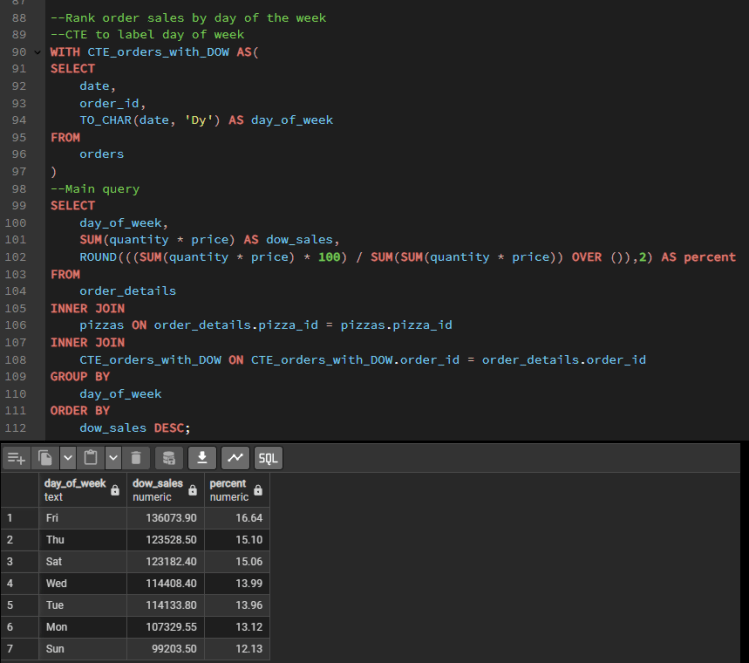
The following query includes two parts–a CTE and a main query. The CTE pulls the date, order id, and adds the day of the week in three-character text. The main query aggregates the total sales for the day of the week, calculates the percentage of the whole, groups the aggregated data, and orders the data by weekday from highest to lowest sales.
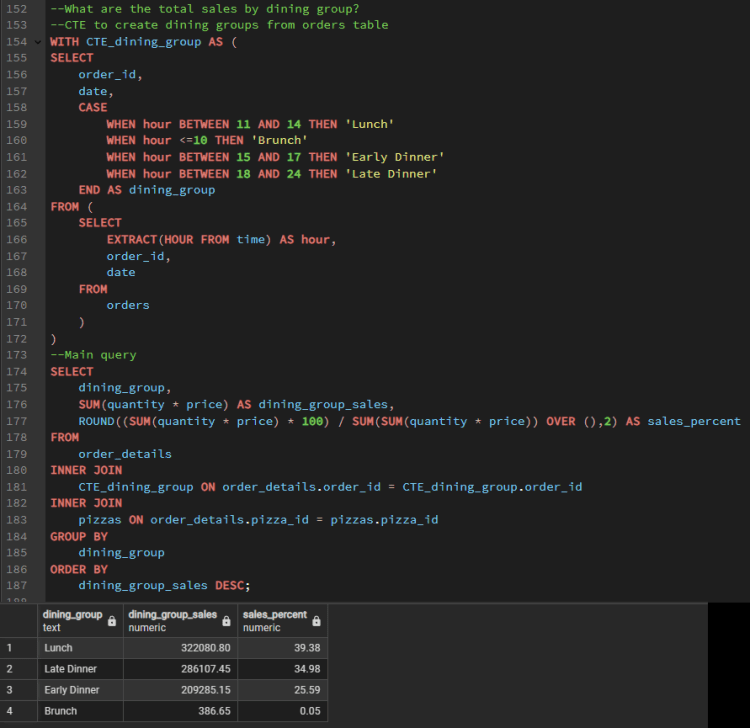
The following query includes two parts–a CTE and a main query. The CTE includes a subquery to extract the hour from the time, along with pulling the order id and date. The result set is used to bin the orders into dining groups using the CASE statement. The main query aggregates the total sales and percentages by dining group, then orders the data by dining group from highest to lowest sales.
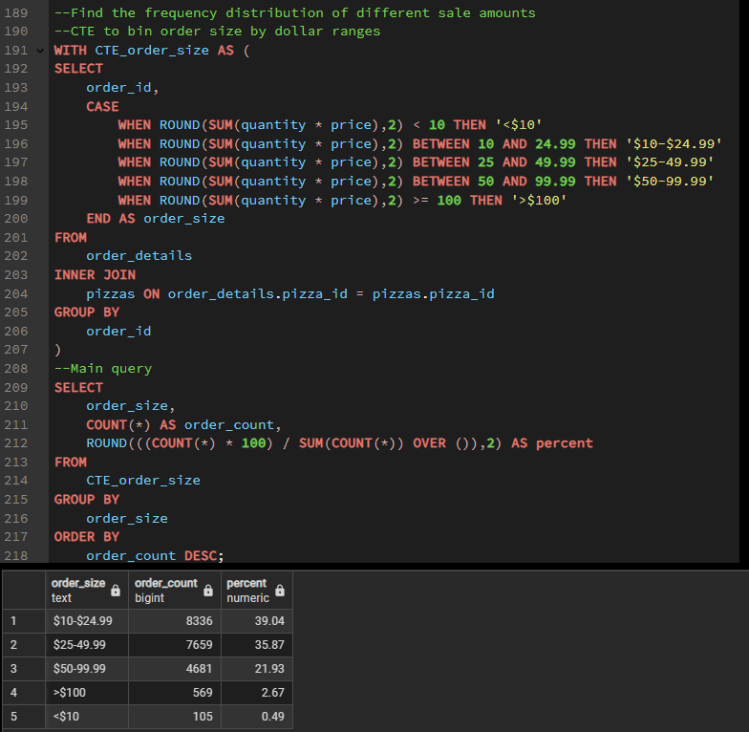
The following query consists of two parts–a CTE and a main query. The CTE bins the total sales into different sale size groups. The main query aggregates the number of orders in each sale size group, determines the percentage of the overall orders, groups by order size, and orders the results from highest to lowest orders.